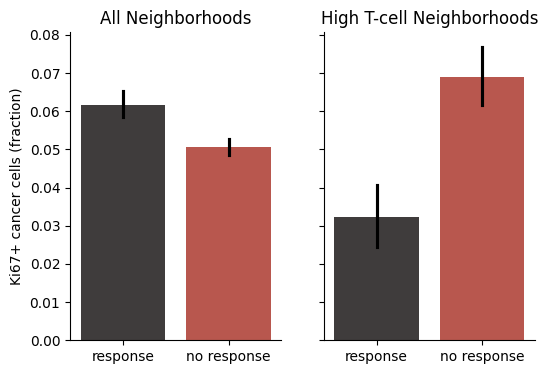
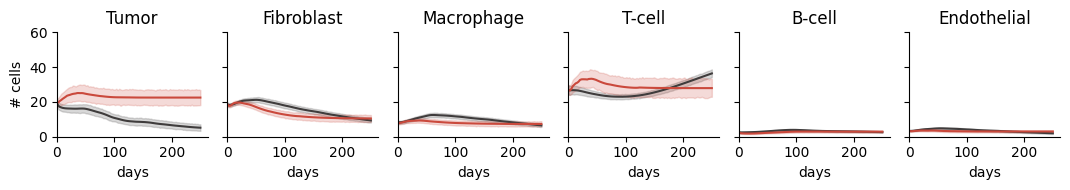
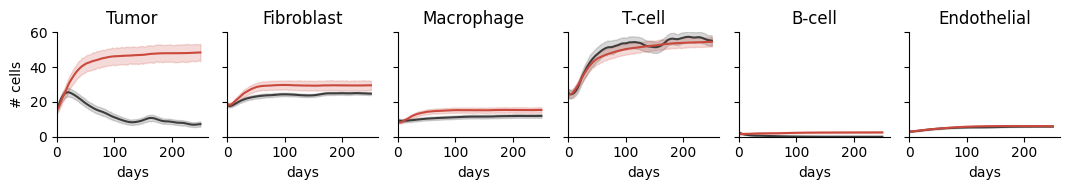
Figure 5 - Dynamics of Triple-negative breast cancer response to treatment#
[1]:
from tdm.publications.first.figures.f5 import fig_5b, fig_5c
[2]:
fig_5b()
Note: This function is computationally intensive and may take several minutes to complete (>10 minutes on some systems)
[3]:
fig_5c()
t-test p-values:
All neighborhoods - response vs no: 3.290e-08
High T-cell neighborhoods - response vs no: 2.625e-08
Response - all vs high T-cell: 4.696e-07
No Response - all vs high T-cell: 3.685e-07