Figure 4 - T- and B- cell dynamics#
[1]:
from tdm.publications.first.figures.f4 import fig_4abc, fig_4d, fig_4e, fig_4f, fig_4g
Fig 4A,B,C: T- and B- cell Phase portrait (left), T-cell growth (middle) and B-cell growth (right)#
[2]:
fig_4abc()
Running..
Please note: fig_4abc() may take a few minutes to complete.
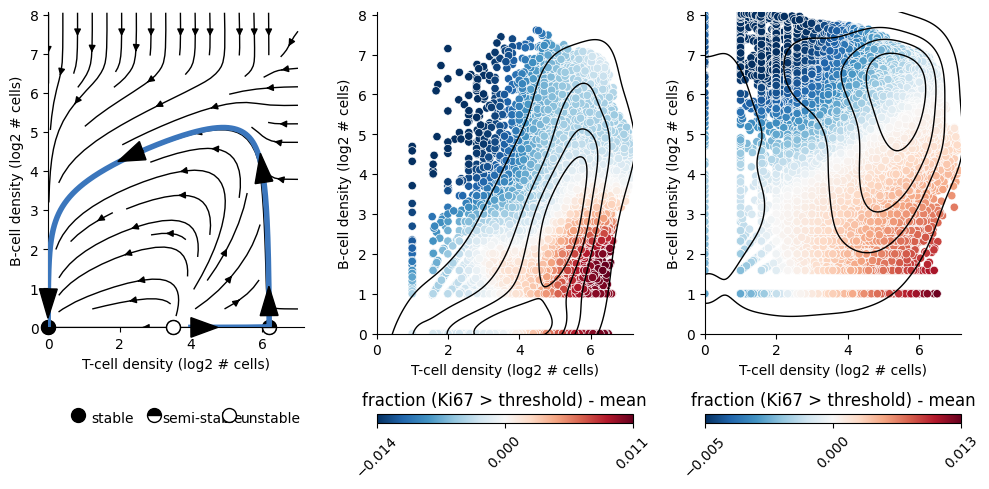
Fig 4D: The TB circuit is excitable: if T cell density crosses a threshold T and B exhibit a pulse#
[3]:
fig_4d()
100%|██████████| 2000/2000 [01:07<00:00, 29.78it/s]
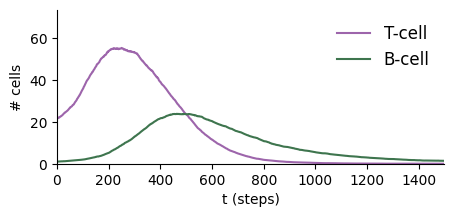
Fig 4F: The TB circuit has a refractory period in which new pulses cannot be triggered#
[4]:
fig_4e()
100%|██████████| 1000/1000 [01:15<00:00, 13.22it/s]
100%|██████████| 1500/1500 [00:20<00:00, 71.63it/s]
100%|██████████| 1000/1000 [01:21<00:00, 12.21it/s]
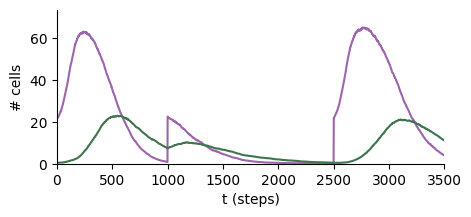
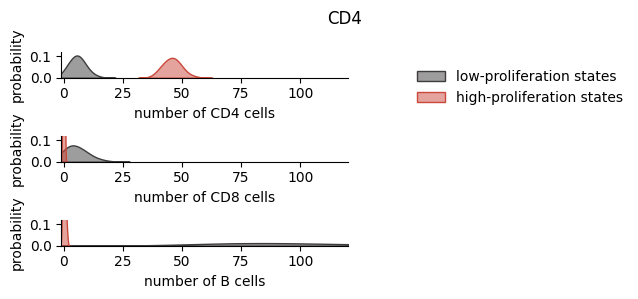
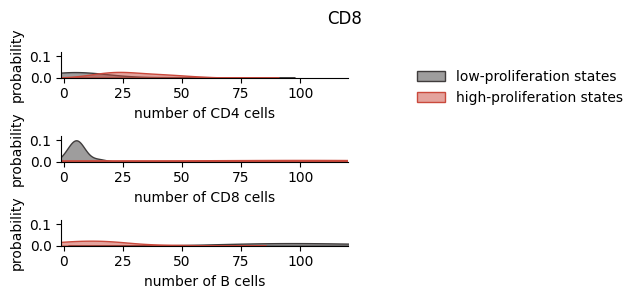
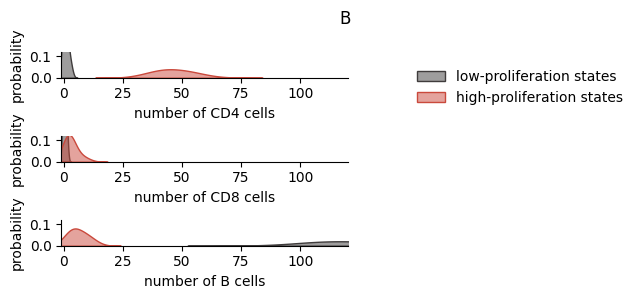
Fig 4F: OSDR 3D model of CD4, CD8 and B-cell dynamics exhibits a pulse when CD4 T cell density crosses threshold#
[5]:
fig_4f()
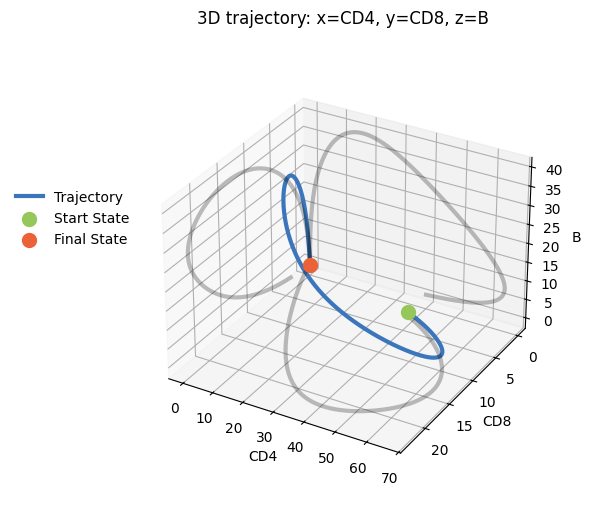
Fig 4G: Adaptive immune cells proliferate in high densities of CD4 T-cells and low densities of B-cells#
[6]:
fig_4g()