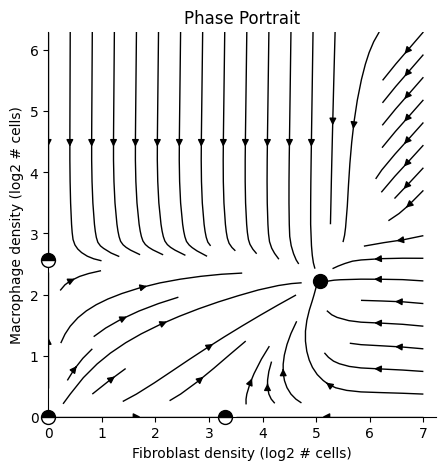
fig, ax = plt.subplots(figsize=(4,4))
plot_phase_portrait(ana, ax=ax, plot_nullclines=False)
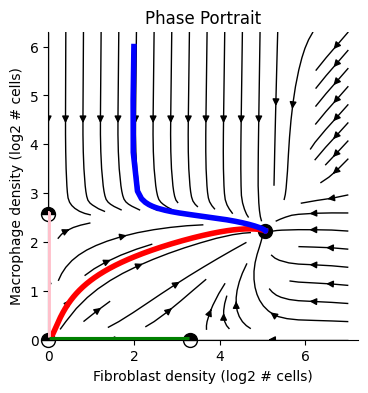
ode_timepoints = np.linspace(0,3000,2000)
plot_trajectory(ana, state0=(0.1,0.1), odeint_timepoints=ode_timepoints, arrow_timepoint_idxs=[], ax=ax, color='red')
plot_trajectory(ana, state0=(2,6), odeint_timepoints=ode_timepoints, arrow_timepoint_idxs=[], ax=ax, color='blue')
plot_trajectory(ana, state0=(0,0.1), odeint_timepoints=ode_timepoints, arrow_timepoint_idxs=[], ax=ax, color='pink')
plot_trajectory(ana, state0=(0.1,0), odeint_timepoints=ode_timepoints, arrow_timepoint_idxs=[], ax=ax, color='green')